概述:使用 GraphViz 画图
Example: Graphviz (dot) examples
[toc]
Dot 命令
dot渲染成其他文件命令:
dot -Tsvg input.dot中文乱码问题
需要设置字体
fontname="Microsoft Yahei"Attributes
cluster
Whether the subgraph is a cluster
digraph cats {
  subgraph cluster_big_cats {
    // This subgraph is a cluster, because the name begins with "cluster"

    "Lion";
    "Snow Leopard";
  }

  subgraph domestic_cats {
    // This subgraph is also a cluster, because cluster=true.
    cluster=true;

    "Siamese";
    "Persian";
  }

  subgraph not_a_cluster {
    // This subgraph is not a cluster, because it doesn't start with "cluster",
    // nor sets cluster=true.

    "Wildcat";
  }
}
colorscheme
A color scheme namespace: the context for interpreting color names
graph {
  node [colorscheme=oranges9] # Apply colorscheme to all nodes
  1 [color=1]
  2 [color=2]
  3 [color=3]
  4 [color=4]
  5 [color=5]
  6 [color=6]
  7 [color=7]
  8 [color=8]
  9 [color=9]
}
compound
If true, allow edges between clusters
digraph {
  compound=true;

  subgraph cluster_a {
    label="Cluster A";
    node1; node3; node5; node7;
  }
  subgraph cluster_b {
    label="Cluster B";
    node2; node4; node6; node8;
  }

  node1 -> node2 [label="1"];
  node3 -> node4 [label="2" ltail="cluster_a"];

  node5 -> node6 [label="3" lhead="cluster_b"];
  node7 -> node8 [label="4" ltail="cluster_a" lhead="cluster_b"];
}
concentrate
If true, use edge concentrators
digraph {
    concentrate=true
    a -> b [label="1"]
    c -> b
    d -> b
}
constraint
If false, the edge is not used in ranking the nodes
digraph G {
a -> c;
a -> b;
b -> c [constraint=false];
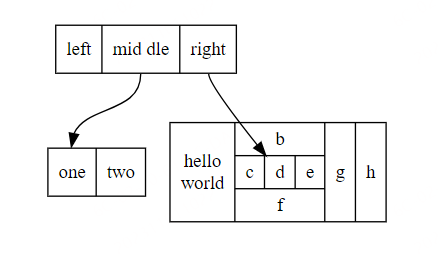
}使用GraphVia画结构体
使用DEMO
digraph structs {
node [shape=record];
struct1 [label="<f0> left|<f1> mid\ dle|<f2> right"];
struct2 [label="<f0> one|<f1> two"];
struct3 [label="hello\nworld |{ b |{c|<here> d|e}| f}| g | h"];
struct1:f1 -> struct2:f0;
struct1:f2 -> struct3:here;
}